This post is the summary of Chung, J., Lee, S., & Park, G. (2025). Prediction of high-risk mountain accident areas using a Hurdle model. Korean Journal of Applied Statistics, 38(4), 531-551.
Objective
This study aims to provide a grid-based Hurdle model to predict the average 6-hourly number of mountain accidents using data from 18 mountainous national parks in South Korea.
Contributions
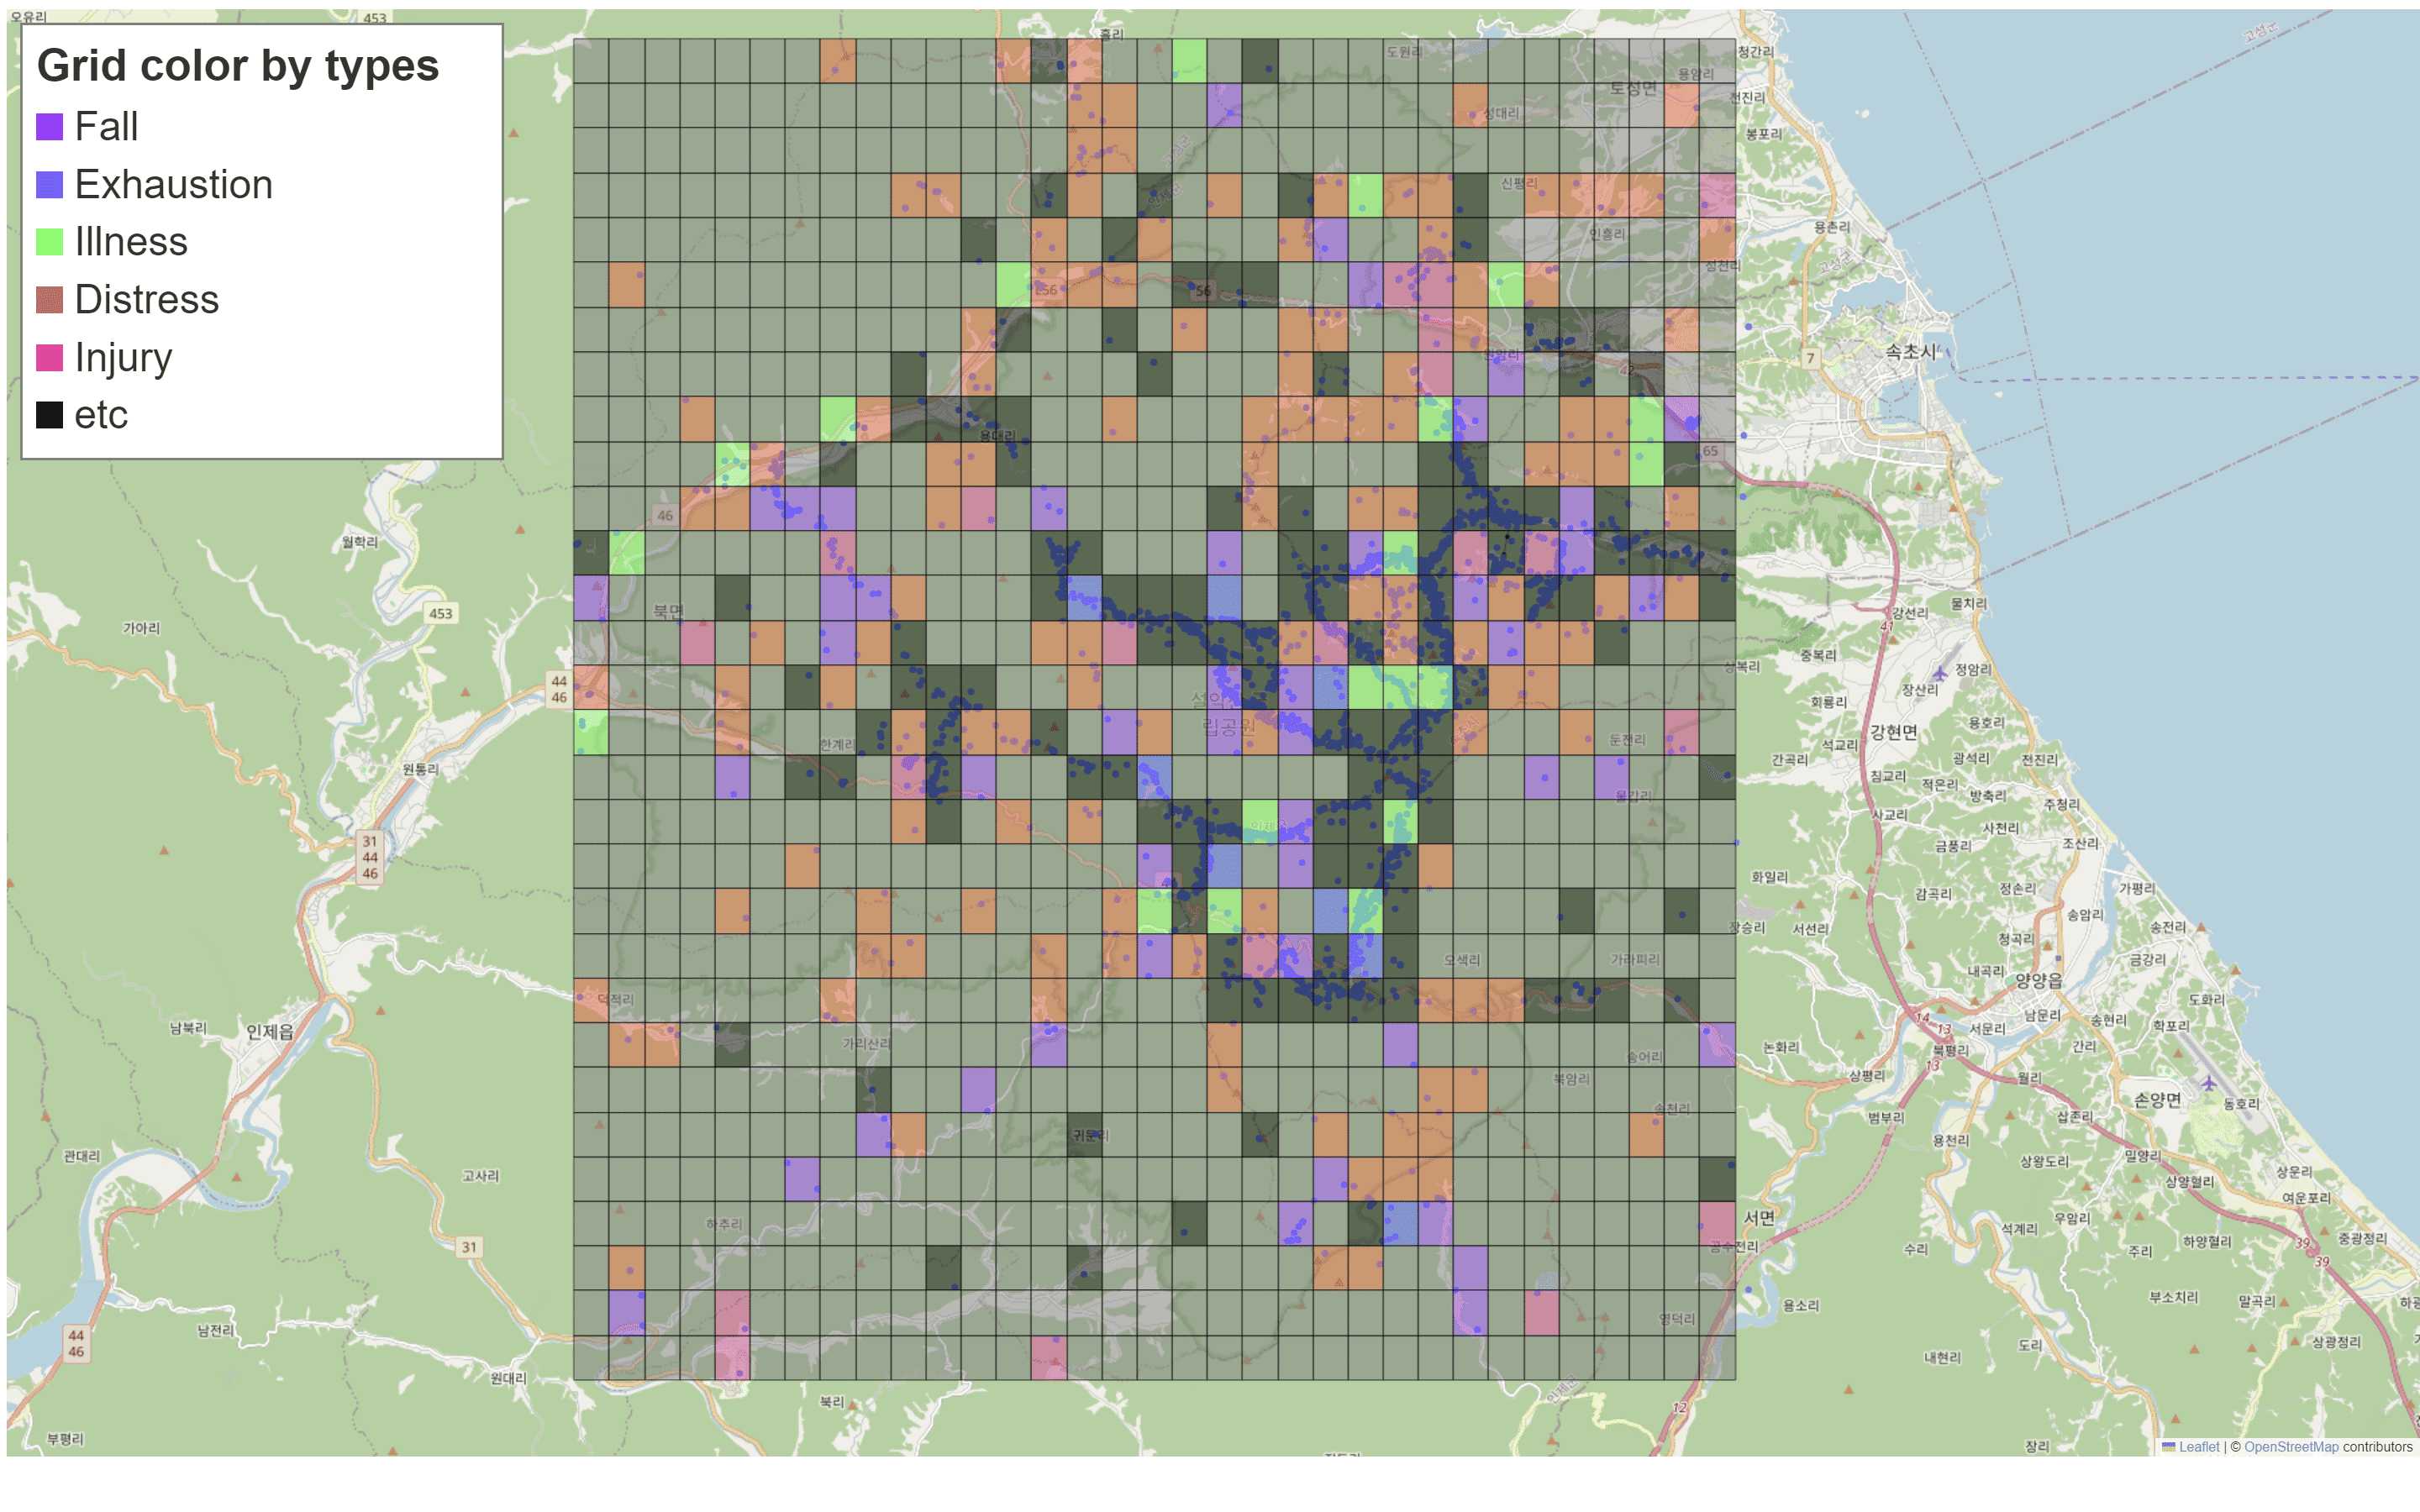
- Applies the grid-based approach, partitioning each national park into a small grid, thereby integrating spatial information such as elevation and slope.
- Uses a Hurdle model to effectively address zero-inflated accident data.
- Reveals that climate-related variables play a crucial role in accident probability, while geological factors (e.g., slope, elevation) are significant for accident frequency.
Hurdle model
- A Hurdle model is a class of statistical models where a random variable is modeled using two parts: (i) the probability to attain zero, and (ii) the probability of the non-zero values.
-
Specifically, the $i$-th response variable $Y_i$ follows a Poisson Hurdle model defined as
\[P(Y_i = y) = \begin{cases} \pi_i , & y = 0, \\ \frac{1-\pi_i}{1-e^{-\lambda_i}} \times \frac{\lambda_i^y e^{-\lambda_i}}{y !} , & y \in \mathbb{N} , \end{cases}\]where $\pi_i$ and $\lambda_i$ parameters are modeled by the $i$-th predictor $\mathbf{x}_i$.
- The Poisson Hurdle model is effective as it decouples the zero and non-zero parts, allowing for separate modeling of each process.
- In this study, we apply distinct models for each component:
- For the zero part: Logistic regression and classification tree-based models (Random Forest, XGBoost, LightGBM, CatBoost).
- For the non-zero part: Poisson regression and the corresponding regression tree models.
Mountain accident data
Data description
| Category | Dataset | Main variables |
|---|---|---|
| Input Variables | ||
| Terrain | Terrain information | Elevation (m), Slope (°) |
| Rescue | Accident details | Mountain name, Accident month, Day of the week, Accident time (hour) |
| Weather | Wind & Pressure | Wind direction/speed (WD, WS), Gust (GST), Atmospheric/Surface pressure (PA, PS), Pressure change (PR, PT) |
| Temp & Humidity | Air temperature (TA), Dew point (TD), Humidity (HM), Vapor pressure (PV) | |
| Precipitation | Rainfall (RN), Daily/Total rainfall, Snow depth (SD), Daily/Total snow depth | |
| Sky & Visibility | Cloud cover (CA), Cloud height (CH), Visibility (VS), Sunshine (SS), Solar irradiance (SI), Cloud classification (CT) | |
| Surface & Others | Surface temperature (TS), Soil temperature (TE), Wave height (WH), Weather conditions (WC, WP) | |
| Output Variables | ||
| Target | Model Targets |
Count: Number of accidents per grid Probability: Accident probability per grid |
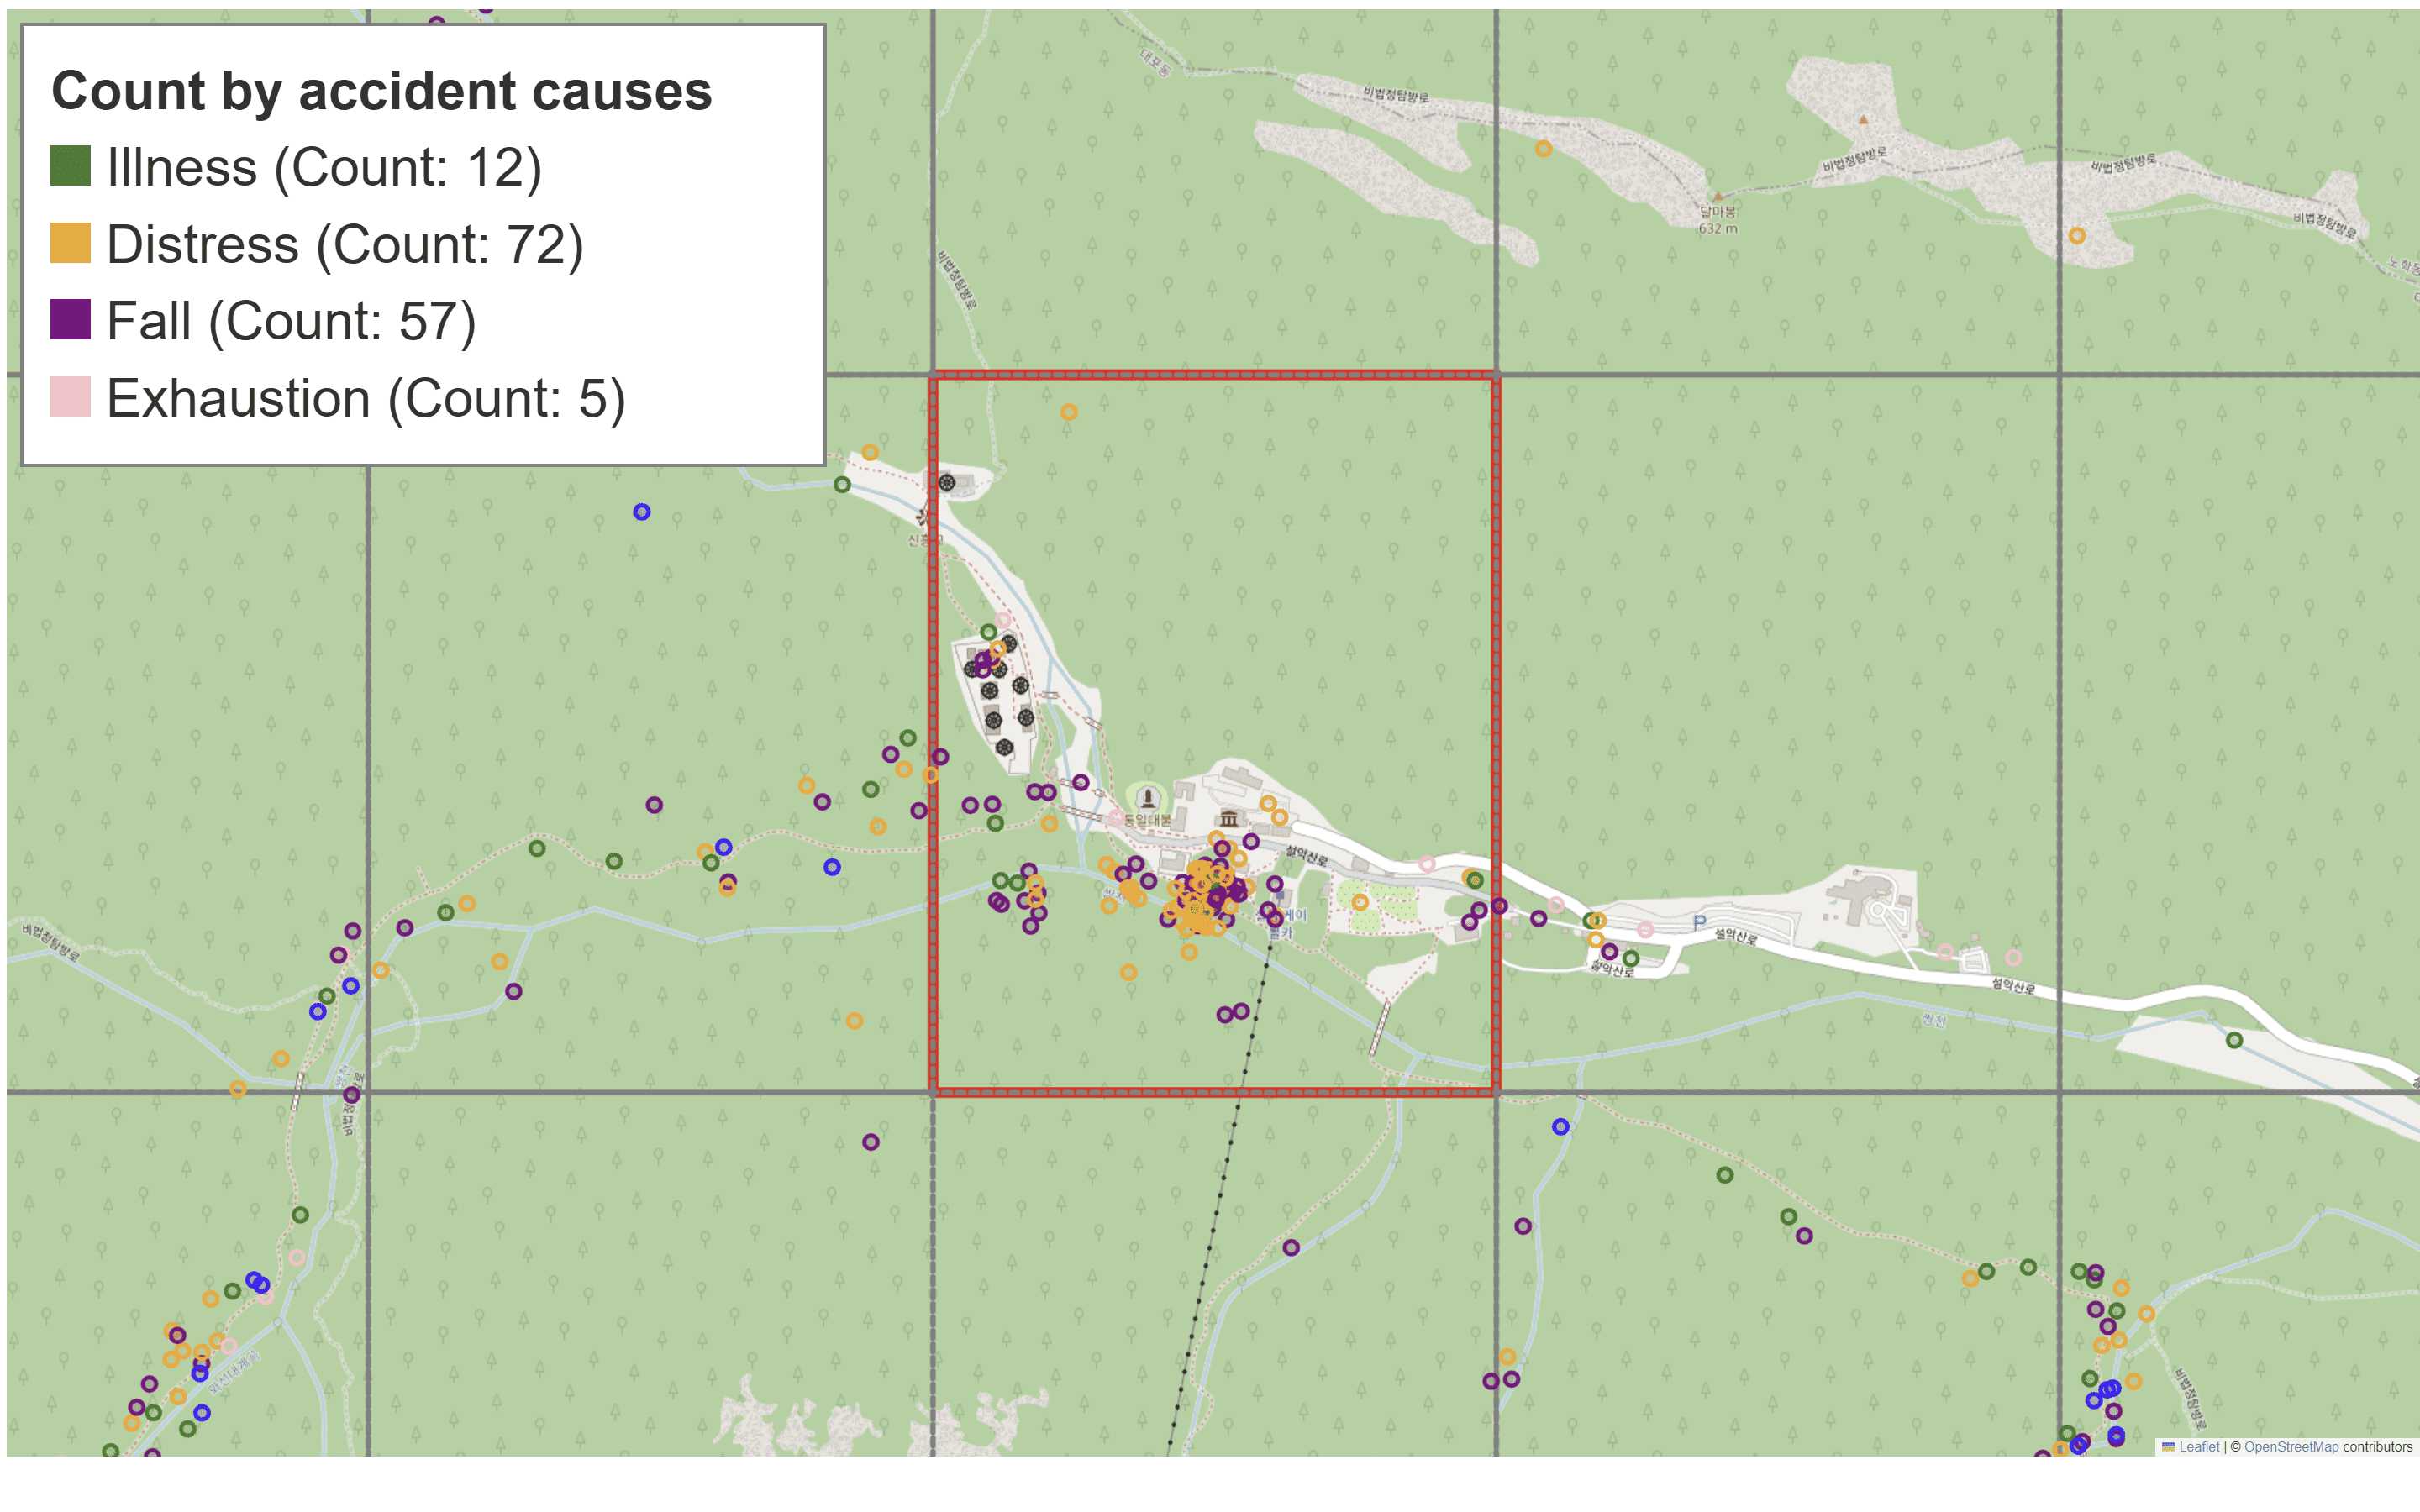
Accident patterns
| Mountain | Area (km²) | Visitors (2023) |
\(\hat{P}(Y = 0)\) (No Accident) |
\(\hat{P}(Y \geq 1)\) (Accident) |
\(\hat{P}(Y \geq 2 \mid Y \geq 1)\) (Multiple) |
|---|---|---|---|---|---|
| Jirisan | 485.65 | 2,318,032 | 0.6151 | 0.3849 | 0.5017 |
| Seoraksan | 400.03 | 3,371,633 | 0.5758 | 0.4242 | 0.6288 |
| Sobaeksan | 321.26 | 1,018,623 | 0.8882 | 0.1118 | 0.4614 |
| Odaesan | 327.90 | 1,330,737 | 0.8946 | 0.1054 | 0.4330 |
| Woraksan | 288.14 | 1,680,573 | 0.8501 | 0.1499 | 0.4752 |
- The above table presents general statistics (area, visitor counts) alongside estimated accident probabilities, where $Y$ denotes the daily number of accidents.
- The proportion of accident-free days ($\hat{P}(Y = 0)$) exceeds 50% for all mountains, highlighting a distinct zero-inflated phenomenon.
- The data suggests a pattern where accidents trigger further accidents ($\hat{P}(Y \geq 2 \mid Y \geq 1)$), as the probability of additional accidents given an occurence is consistently higher than the unconditional accident probability ($\hat{P}(Y \geq 1)$).
Results
Prediction performance
| Metric | Logistic Regression |
Random Forest |
XGBoost | LightGBM | CatBoost |
|---|---|---|---|---|---|
| Accuracy | 0.81 | 0.81 | 0.96 | 0.95 | 0.93 |
| F1-score | 0.27 | 0.27 | 0.34 | 0.47 | 0.42 |
| BIC | 6160.27 | 5760.58 | 6272.31 | 4265.63 | 4232.00 |
| Metric | Poisson Regression |
Random Forest |
XGBoost | LightGBM | CatBoost |
|---|---|---|---|---|---|
| MSE | 0.24 | 0.24 | 0.27 | 0.26 | 0.23 |
| Poisson deviance | 0.16 | 0.16 | 0.17 | 0.17 | 0.15 |
| BIC | 2439.26 | 2438.48 | 2394.82 | 1720.25 | 1690.31 |
- In probability prediction, gradient boosting methods (XGBoost, LightGBM, CatBoost) generally show superior performance compared to linear or tree-based baselines.
- Specifically, LightGBM achieved the highest F1-score, making it the most suitable model for identifying accident occurrences within imbalanced data.
- CatBoost recorded the best BIC, demonstrating high efficiency by effectively handling categorical variables with lower dimensionality.
- In count prediction, CatBoost outperforms all other models across every metric.
- This highlights CatBoost’s strength in leveraging categorical information, which appears crucial for count prediction.
- Interestingly, other GBDT models did not significantly surpass Poisson Regression, suggesting that the relationship between accident counts and predictors is relatively linear and simple.
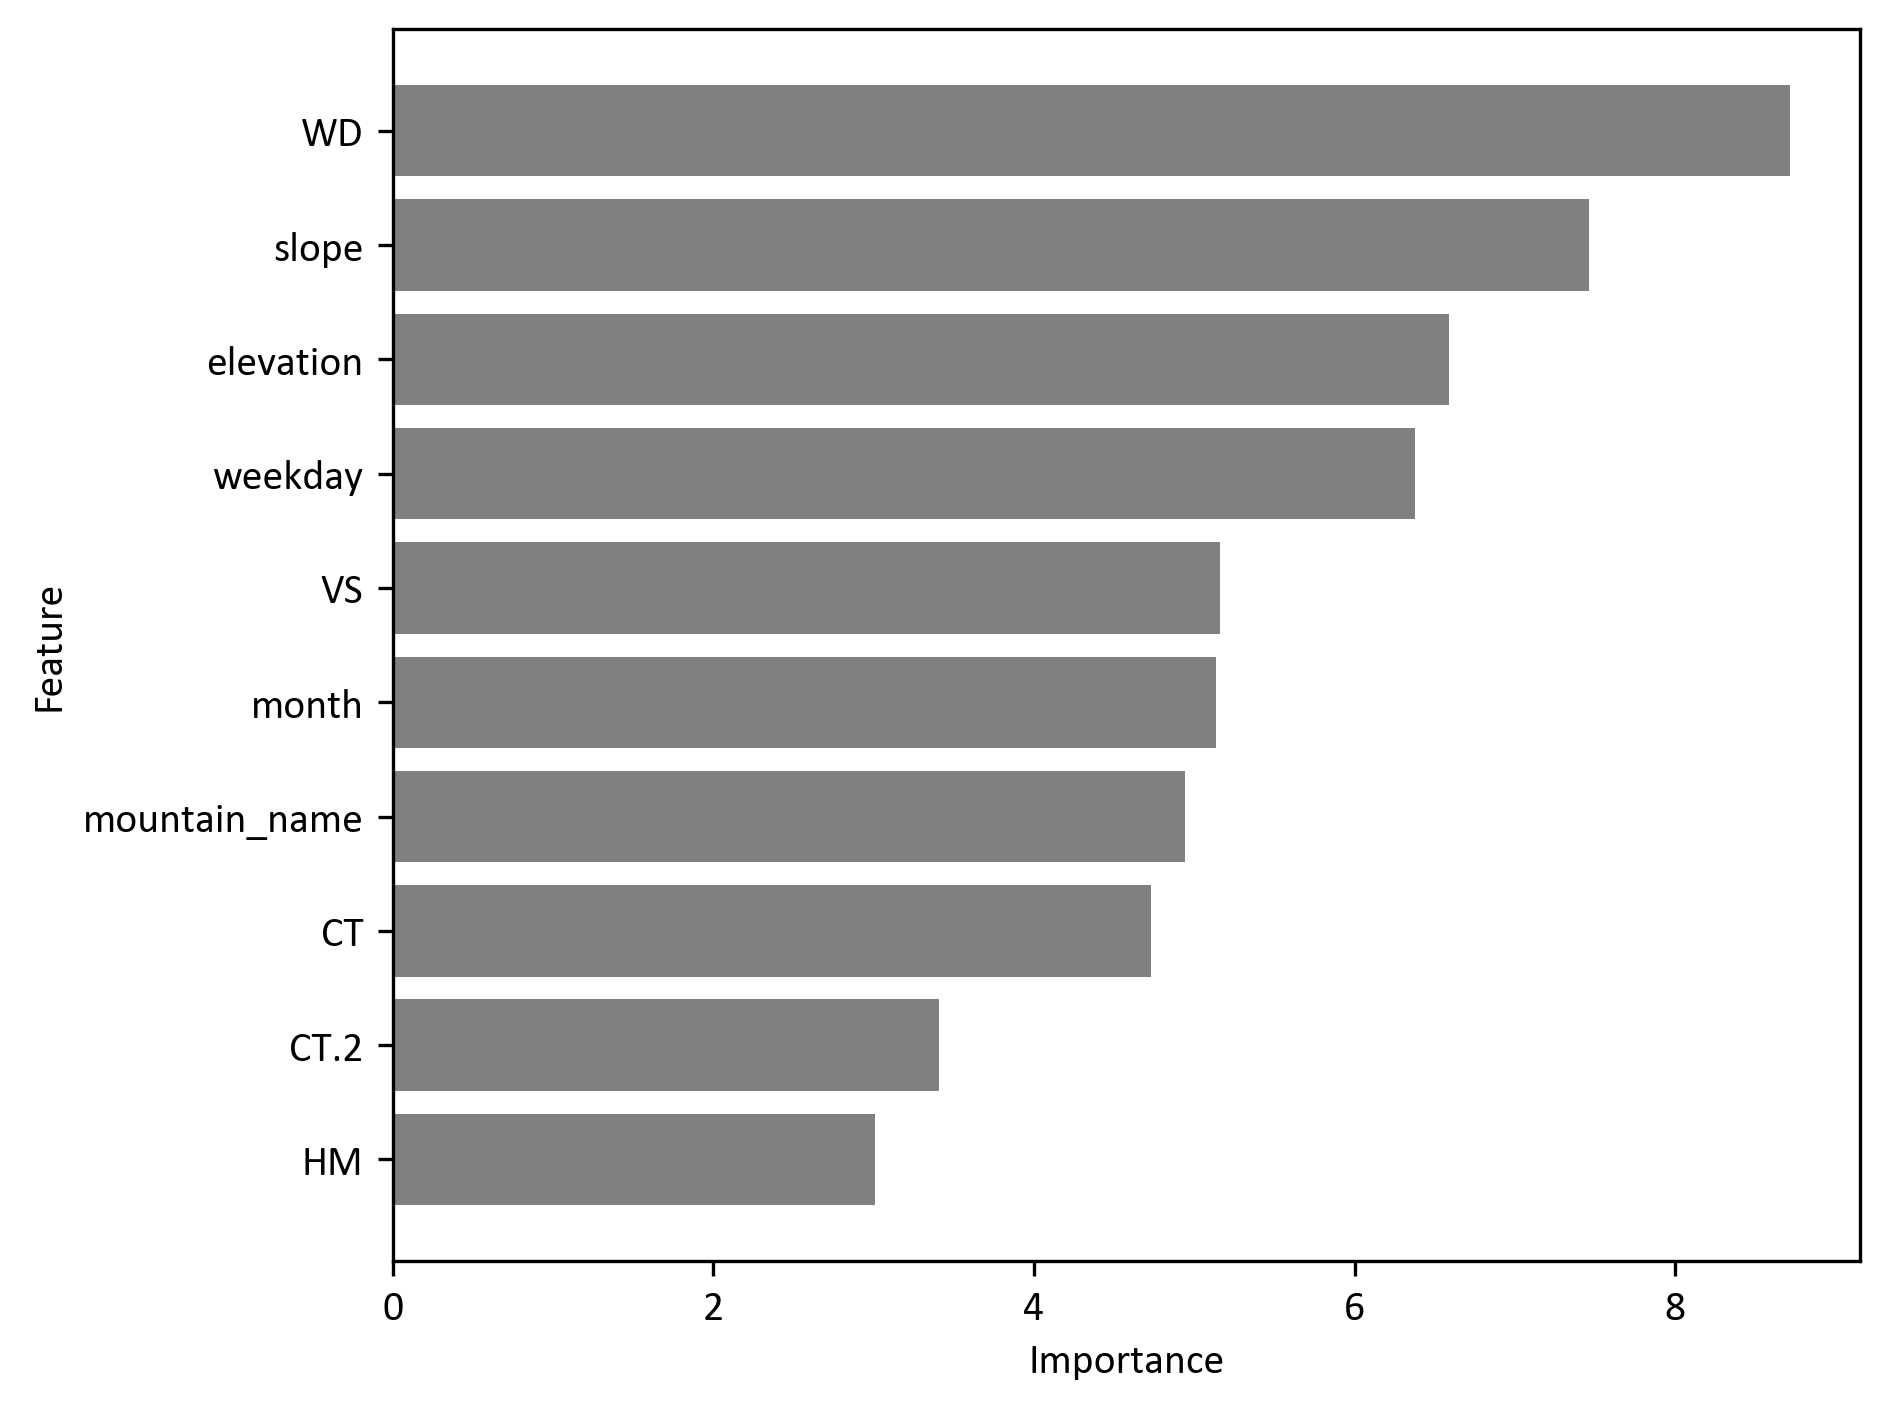
Feature importance analysis
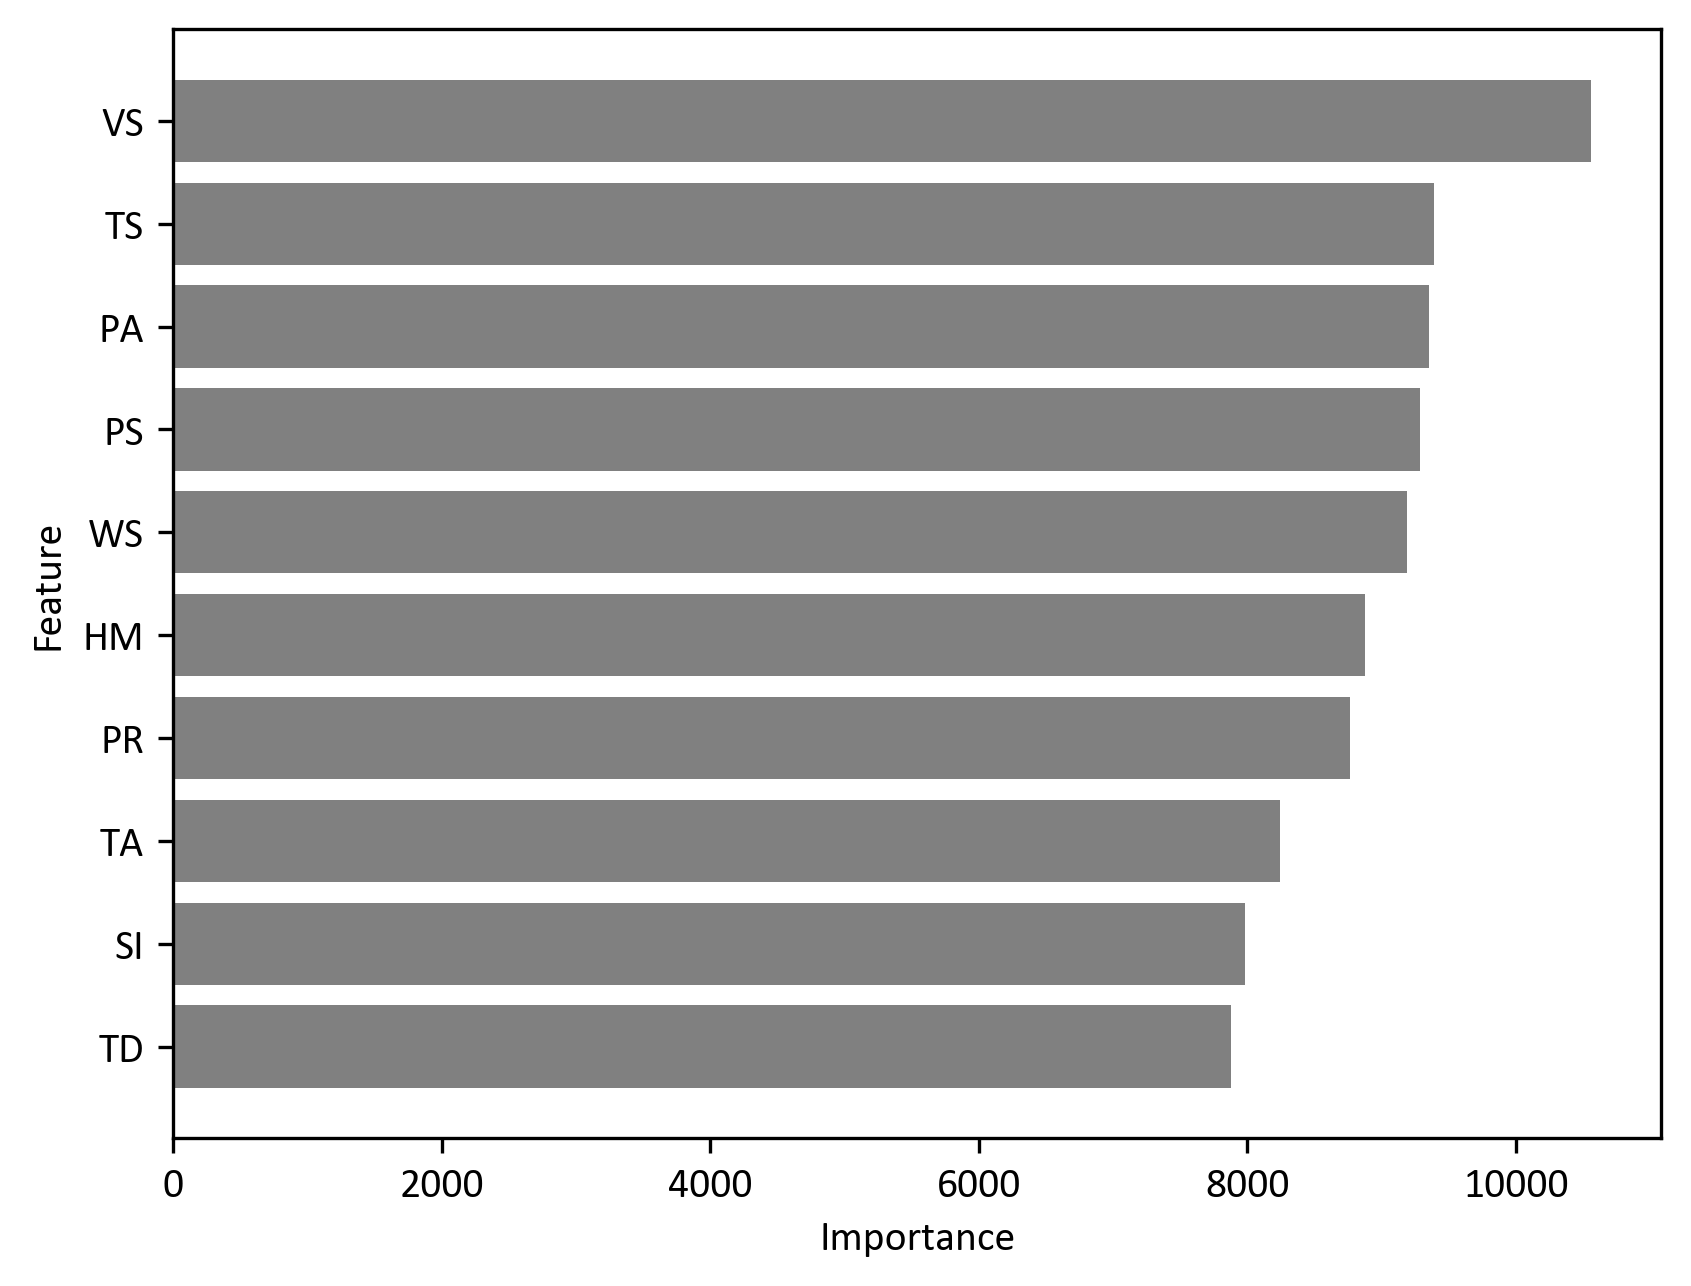
- Probability prediction: Dominantly influenced by weather variables (e.g., visibility, temperature, wind speed), suggesting that immediate meteorological conditions are the primary drivers of accident occurrence.
- Count prediction: Heavily relies on categorical variables (day, month) and terrain features (elevation, slope), indicating that visitor patterns and structural risks drive accident frequency and potential chain reactions.
- Distinct drivers: While visibility and humidity affect both models, terrain factors play a significantly larger role in predicting the number of accidents compared to the mere probability of an event.
References
- Chung, J., Lee, S., & Park, G. (2025). Prediction of high-risk mountain accident areas using a Hurdle model. Korean Journal of Applied Statistics, 38(4), 531-551.