This post is the summary of Chung, J., Shin, D., Hwang, S., & Park, G. (2024). Horse race rank prediction using learning-to-rank approaches. Korean Journal of Applied Statistics, 37(2), 239-253.
Objective
This research aims to apply the Learning-to-Rank technique to horse racing and compare its performance with existing research.
Contributions
- Applies the pair-wise learning approach to horse racing that has been relatively underexplored.
- Uses various datasets such as
Start training informationandHorse diagnosis record, which contributes to the enhancement of predictability and interpretability. - Resolves the issue of data imbalance due to varying race distances by standardizing the race records.
- Ensures the model interpretability through the use of Shapley value analysis.
Learning-to-Rank
| Rank | Score | Item vector | Query vector |
|---|---|---|---|
| 1 | \(y_1^1\) | \(\mathbf{x}_1^1\) | \(\mathbf{z}_1\) |
| 2 | \(y_1^2\) | \(\mathbf{x}_1^2\) | \(\mathbf{z}_1\) |
| 3 | \(y_1^3\) | \(\mathbf{x}_1^3\) | \(\mathbf{z}_1\) |
| \(\pi_1\) | \(\mathbf{y}_1\) | \(\mathbf{X}_1\) | \(\mathbf{Z}_1\) |
Table 1. Query 1 Example (\(n_1 = 3\))
| Rank | Score | Item vector | Query vector |
|---|---|---|---|
| 1 | \(y_2^1\) | \(\mathbf{x}_2^1\) | \(\mathbf{z}_2\) |
| 2 | \(y_2^2\) | \(\mathbf{x}_2^2\) | \(\mathbf{z}_2\) |
| 3 | \(y_2^3\) | \(\mathbf{x}_2^3\) | \(\mathbf{z}_2\) |
| \(\pi_2\) | \(\mathbf{y}_2\) | \(\mathbf{X}_2\) | \(\mathbf{Z}_2\) |
Table 2. Query 2 Example (\(n_2 = 3\))
-
The Learning-to-Rank (LTR) technique is a machine learning method used for ranking predictions in various fields, including information retrieval systems, recommendation systems, online advertising, and document classification.
-
The goal of the Learning-to-Rank (LTR) technique is to identify a predictive function $\hat{f}$ by minimzing an appropriate loss function $\mathcal{L}$ by
Point-wise learning
Point-wise learning is a method that learns the score of each item individually. For example, if $\ell_2$-norm is chosen for the 2-queries case as above, the loss function would be
\[\mathcal{L} = \sum_{q=1}^2\left[ (y_q^1 - f(\mathbf{x}_q^1,\mathbf{z}_q))^2 + (y_q^2 - f(\mathbf{x}_q^2,\mathbf{z}_q))^2 + (y_q^3 - f(\mathbf{x}_q^3,\mathbf{z}_q))^2 \right] .\]- It focuses solely on predicting the scores of individual items and does not learn the relationships or order among items within a query.
- E.g., linear regression, random forest, etc.
Pair-wise learning
Pair-wise learning is a method that compares the scores of all possible pairs of items and predicts higher scores for those with higher ranks.
\[\mathcal{L} = -\sum_{q=1}^2\left[ \log{P_{12}} + \log{P_{13}} + \log{P_{23}} \right] , \quad \text{where} \quad P_{ij} = \frac{1}{1+e^{-\sigma(\hat{y}_q^i - \hat{y}_q^j)}}, \quad \sigma > 0 .\]- It not only enables the learning of the relative ranking relationships between items but is also efficient in that it requires significantly less computational effort compared to considering all possible combinations.
- E.g., RankNet, LambdaMART(XGBoost, LightGBM, CatBoost), etc.
List-wise learning
List-wise learning directly optimizes a ranking metric or loss function based on the order of items in the entire list.
\[\mathcal{L} = -\sum_{q=1}^2\log\left[ \frac{e^{\hat{y}_q^1}}{e^{\hat{y}_q^1}+e^{\hat{y}_q^2}+e^{\hat{y}_q^3}} \times \frac{e^{\hat{y}_q^2}}{e^{\hat{y}_q^2}+e^{\hat{y}_q^3}} \times \frac{e^{\hat{y}_q^3}}{e^{\hat{y}_q^3}} \right] .\]- It addresses the limitation of the pair-wise approach by learning the complete relationships within each query. However, it requires a large sample size and may struggle to perform effectively when faced with issues such as missing values or outliers.
- E.g., ListNet, ListMLE, etc.
Horse race data
Data description
| Category | Dataset | Main variables |
|---|---|---|
| **Data Collection Period: 2013.01 ~ 2023.07** | ||
| Race | Race performance data | Race time, ranking, grade, number of horses, race number, race distance, carried weight, weight change |
| Track information | Track moisture, track condition | |
| Weather information | Weather | |
| Jockey | Jockey career records | Total 1st, 2nd, 3rd place counts and total race entries |
| Horse | Horse career records | Total 1st, 2nd, 3rd place counts and total race entries |
| Detailed horse data | Age, weight, gender, origin | |
| Veterinary records | Diagnosis counts | |
| Starting training data | Starting training sessions | |
| Trainer | Trainer career records | Total 1st, 2nd, 3rd place counts and total race entries |
| Trainer details | Trainer experience | |
Standardization of race record
\[y_q^j = \frac{\tilde{y}_q^j - \bar{\tilde{y}}_d}{\frac{1}{N_d - 1}\sum_{l \in S_d}\sum_{i=1}^{n_l}(\tilde{y}_l^i-\bar{\tilde{y}}_d)^2}, \quad \text{where} \quad N_d = \sum_{l \in S_d}n_l , \quad \bar{\tilde{y}}_d = \frac{1}{N_d}\sum_{l \in S_d}\sum_{i=1}^{n_l}\tilde{y}_l^i .\]- $S_d$ is the collection of queries where the race distance is $d$, and $\tilde{y}_q^i$ is horse $i$’s race record in query $q$.
- Since race records vary depending on the corresponding distance, this variation hinders the model’s ability to predict ranks consistently.
- This data imbalance issue can be resolved by standardizing the race records.
Evaluation methods and results
Evaluation methods
- Win ratios for single, exacta, and trifecta bets, along with Spearman’s correlation coefficient, Kendall’s tau, and NDCG, were used as evaluation metrics.
- After splitting the data into training and evaluation sets, the evaluation metrics were computed 100 times in total for the evaluation dataset.
Result
| Metric | Point-wise learning | Pair-wise learning | ||||
|---|---|---|---|---|---|---|
| Linear regression | Random forest | RankNet | XGBoost Ranker | LightGBM Ranker | CatBoost Ranker | |
| Win probablity (Single) | 0.2744 (0.0117) | 0.2598 (0.0102) | 0.2600 (0.0124) | 0.2733 (0.0102) | 0.2803 (0.0110) | 0.3049 (0.0107) |
| Win probablity (Exacta) | 0.1155 (0.0066) | 0.1070 (0.0074) | 0.1087 (0.0090) | 0.1142 (0.0069) | 0.1225 (0.0065) | 0.1345 (0.0075) |
| Win probablity (Trifecta) | 0.0643 (0.0058) | 0.0579 (0.0062) | 0.0585 (0.0067) | 0.0625 (0.0060) | 0.0701 (0.0052) | 0.0771 (0.0059) |
| Spearman correlation | 0.4080 (0.0077) | 0.3859 (0.0074) | 0.3844 (0.0157) | 0.4037 (0.0070) | 0.4284 (0.0071) | 0.4474 (0.0075) |
| Kendall's Tau | 0.3129 (0.0062) | 0.2951 (0.0058) | 0.2935 (0.0126) | 0.3083 (0.0058) | 0.2935 (0.0126) | 0.3439 (0.0061) |
| NDCG | 0.7025 (0.0040) | 0.7001 (0.0043) | 0.6901 (0.0071) | 0.7002 (0.0042) | 0.6901 (0.0071) | 0.7149 (0.0042) |
- A total of six models were fitted, including linear regression and random forest from point-wise learning, and RankNet, LambdaMART (XGBoost, LightGBM, and CatBoost) from pair-wise learning.
- Except for RankNet, the pair-wise learning models generally outperformed the point-wise learning models.
- The CatBoost Ranker demonstrated the best performance across all evaluation metrics, likely due to its strong capability in handling categorical variables.
Shapley value: Point-wise vs. Pair-wise


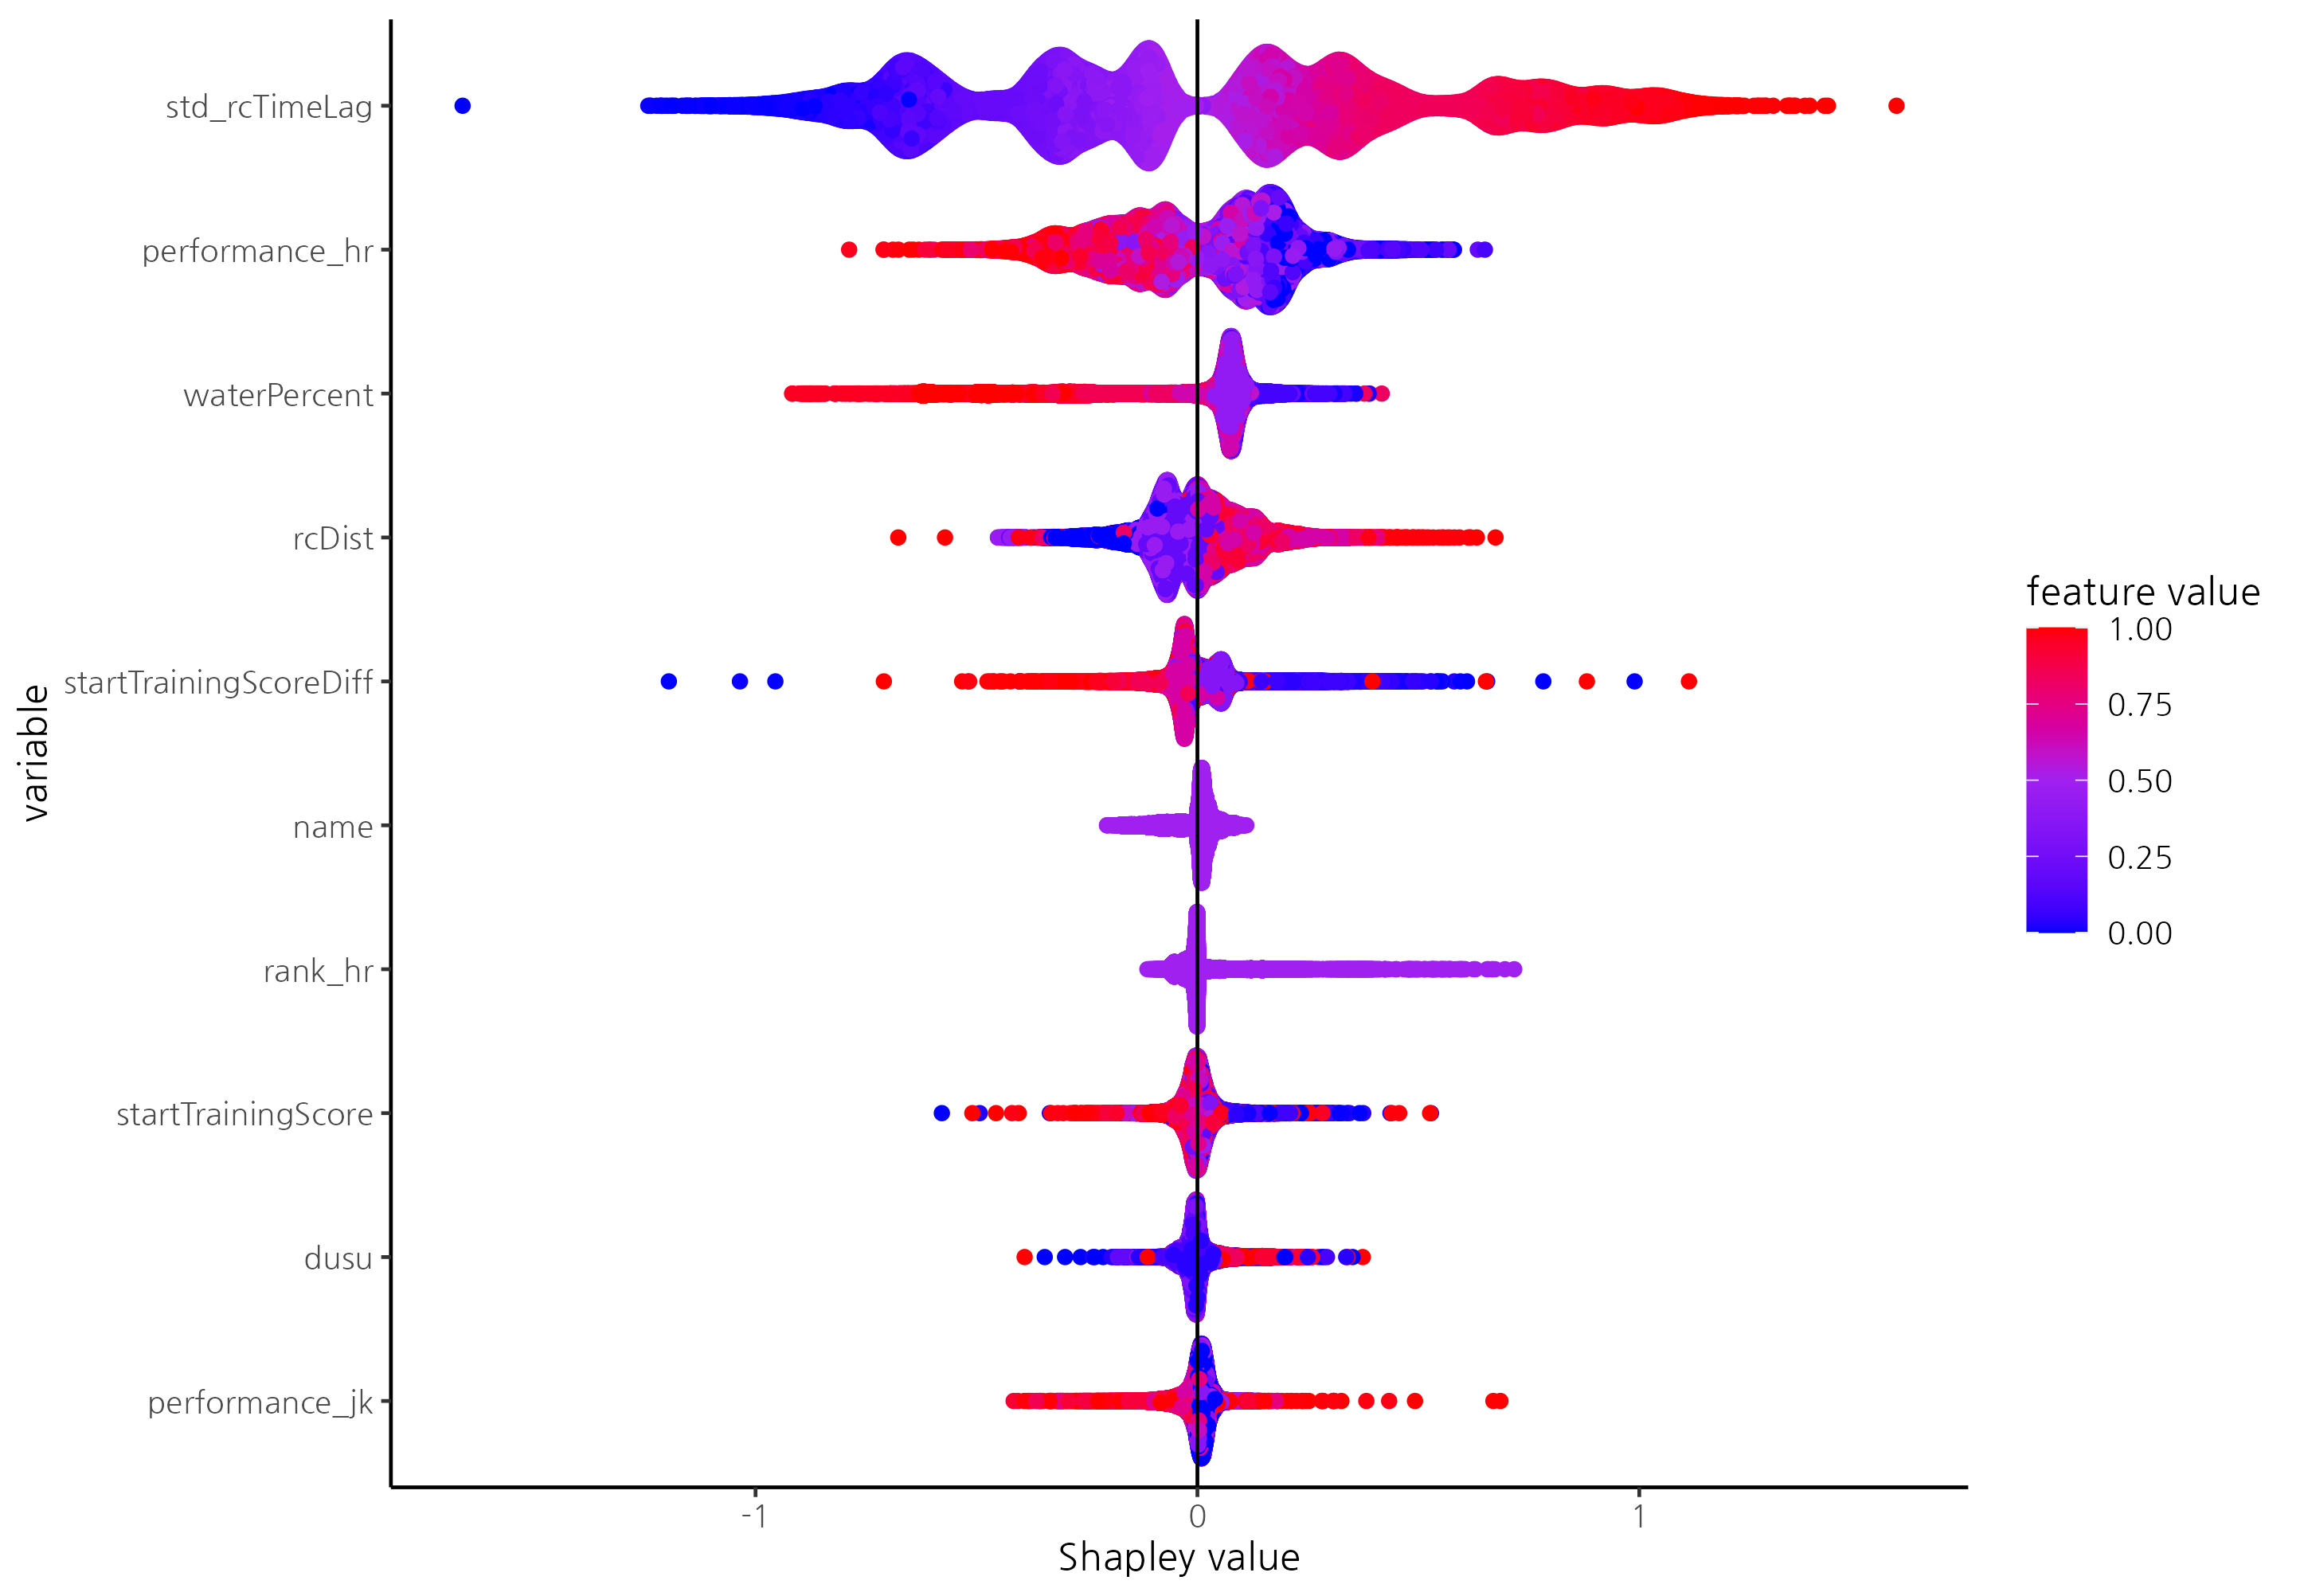
- Newly added variables, such as standardized previous race records and horse performance, significantly influence prediction performance.
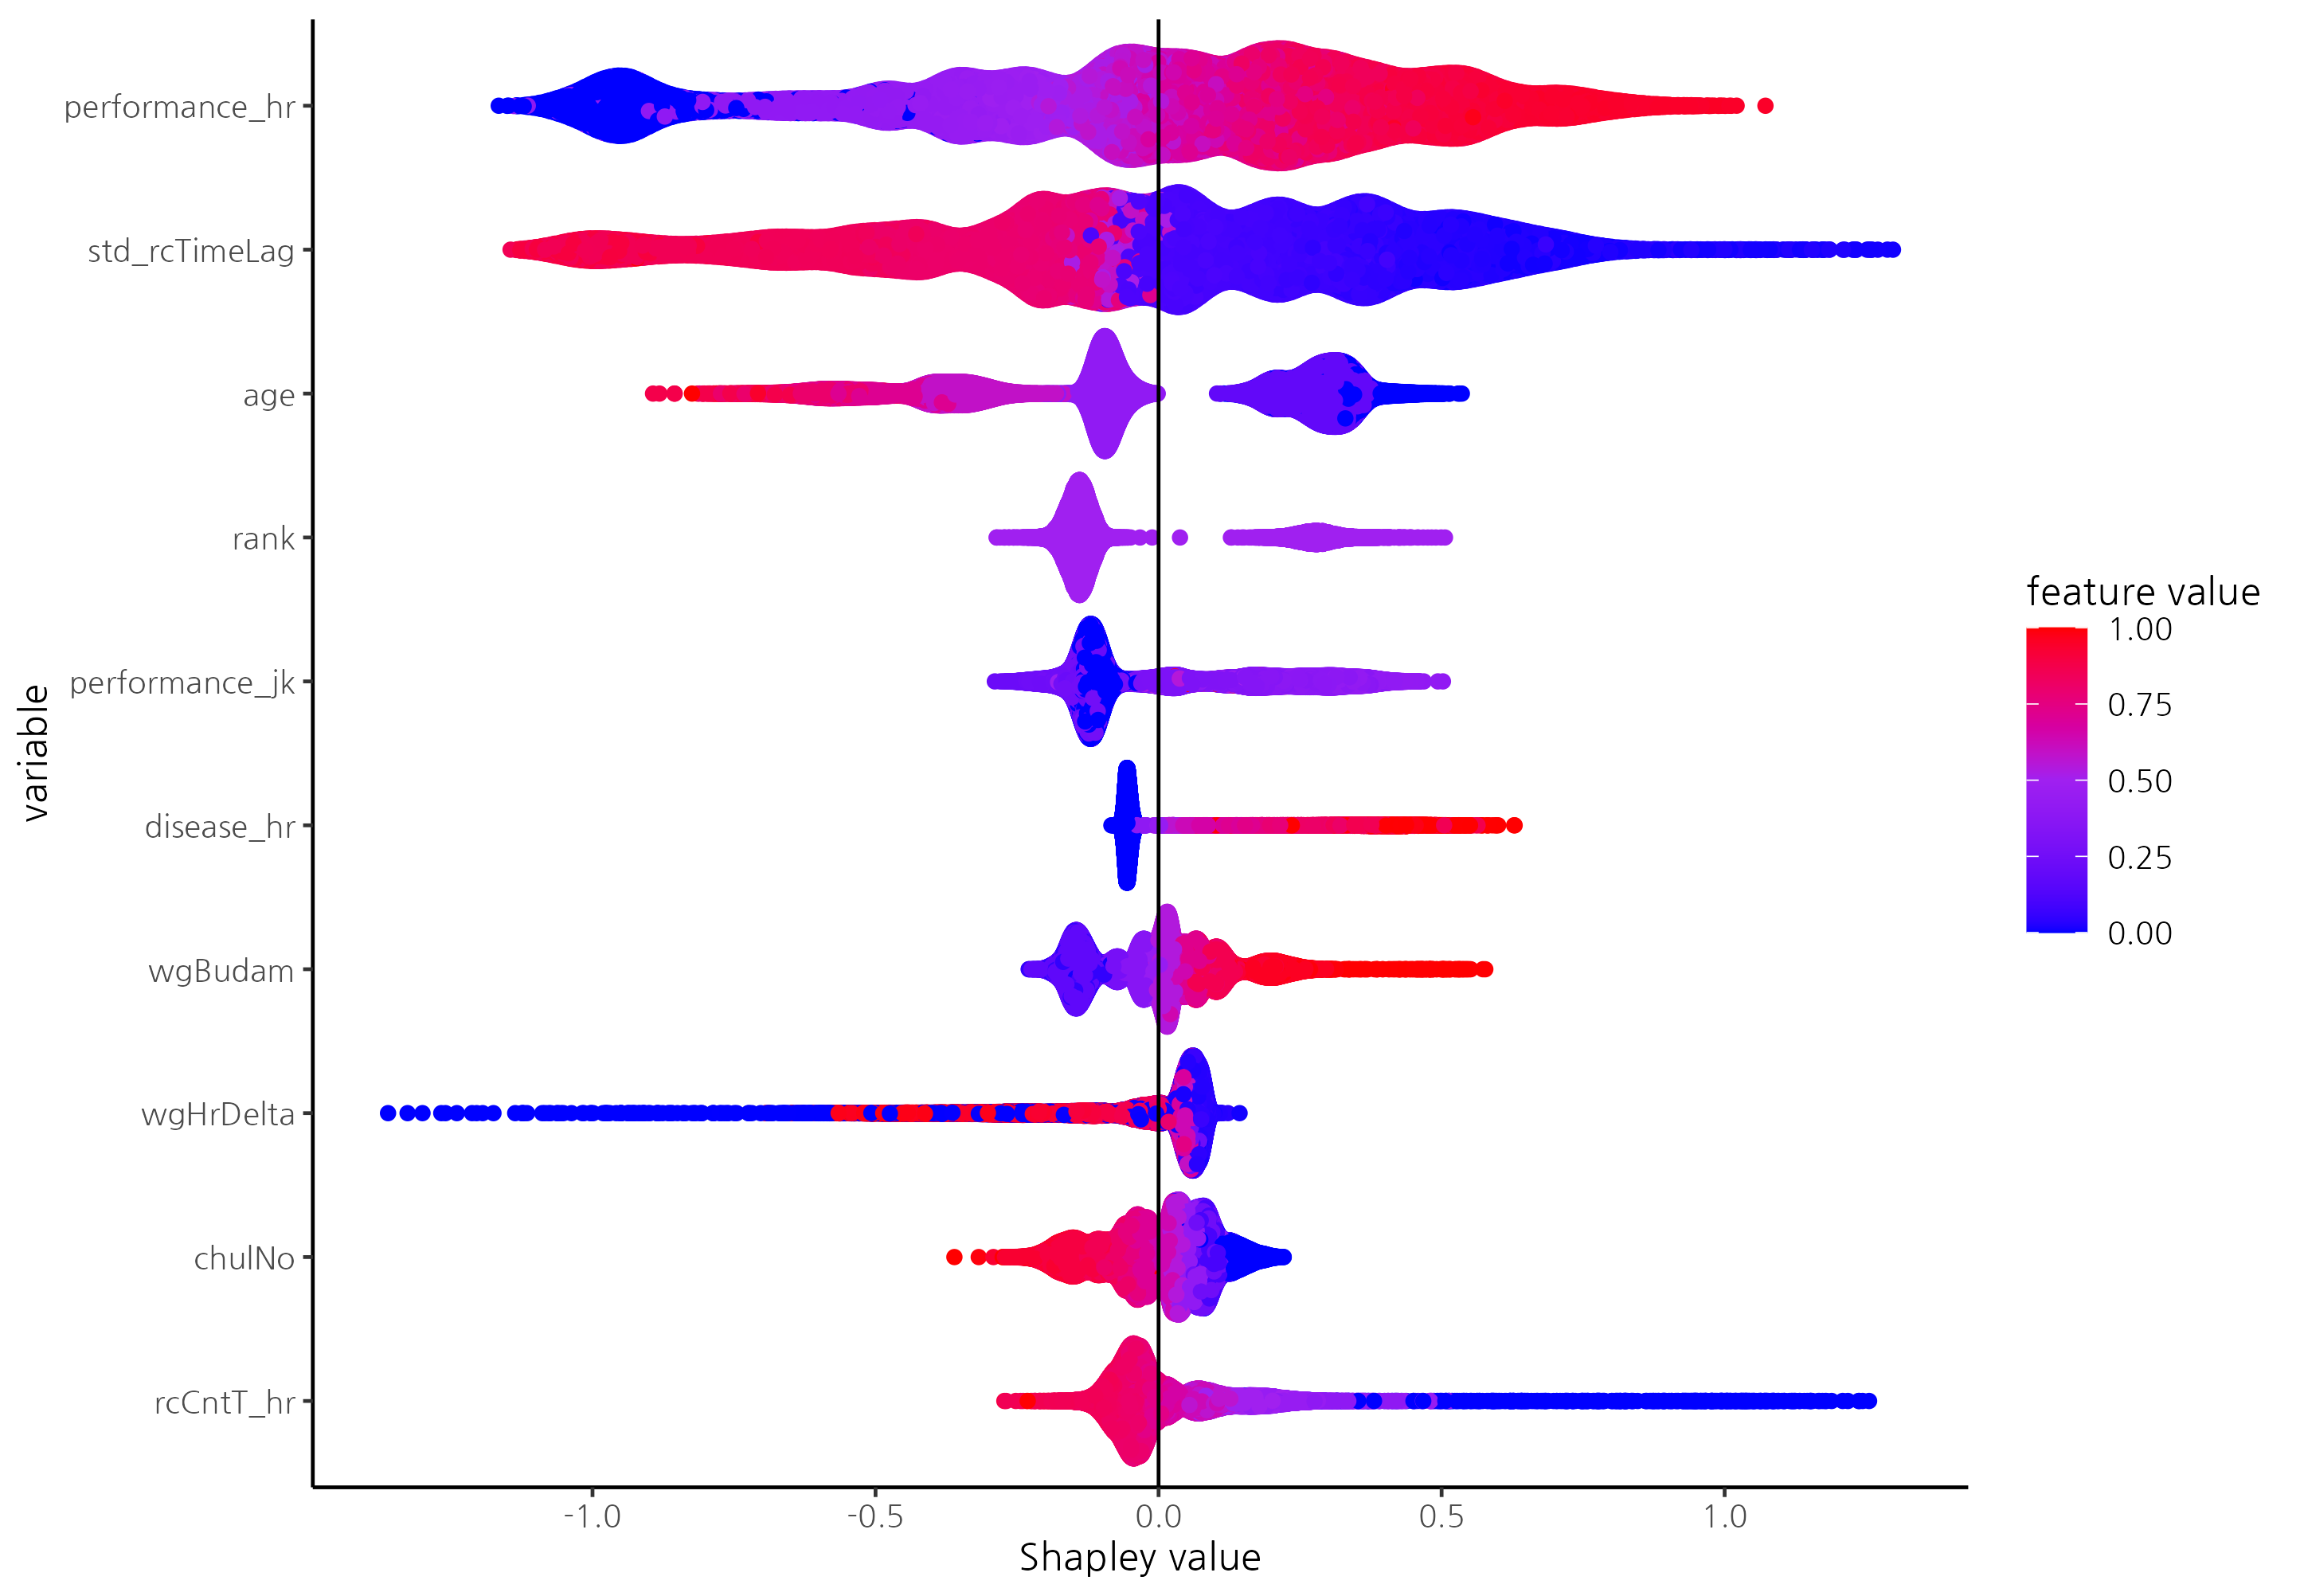
- In point-wise models like random forest, common variables shared across races, such as humidity and race distance, were selected as key predictors. In contrast, in pair-wise models like the CatBoost Ranker, variables reflecting differences among horses, such as horse age and carried weight, were identified as key factors.
- This highlights the characteristics of pair-wise learning, suggesting that variables representing relative differences in horse abilities are more critical for rank prediction.
- The CatBoost Ranker tends to predict shorter standardized race records for horses with better previous performances and shorter standardized previous race records.
- Additionally, it predicts shorter standardized race records for younger horses, those with lower race entry numbers, and higher track humidity levels, aligning with findings from previous research.
Performance of CatBoost Ranker

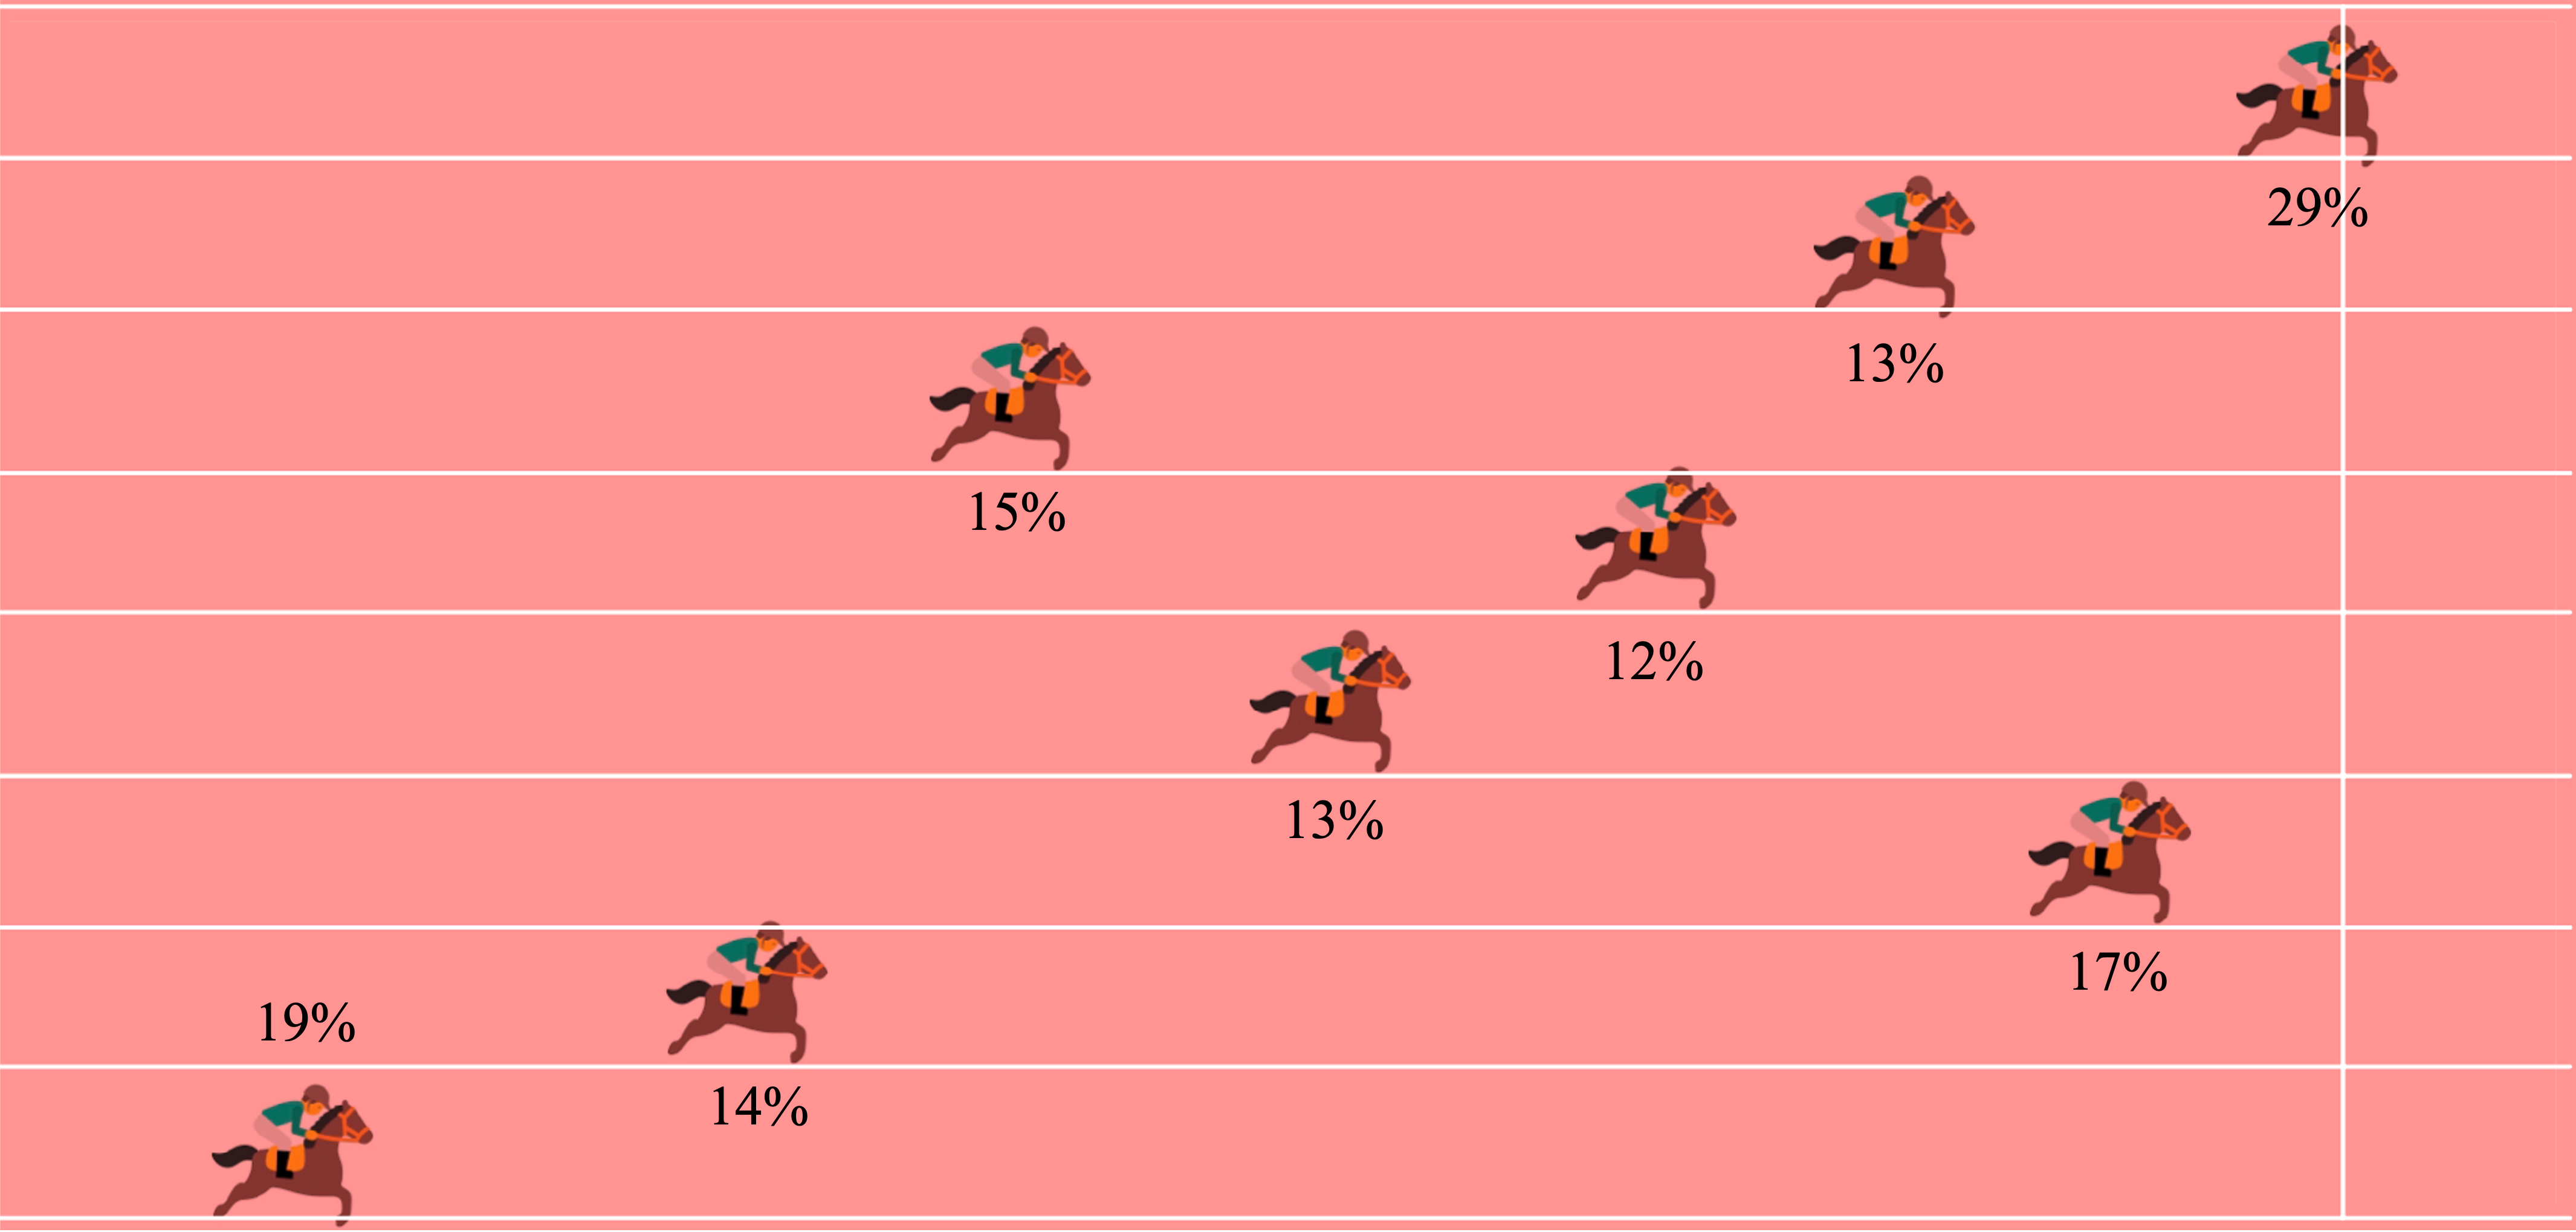
- The precision for each rank was calculated on a new dataset from Jul 2023 - Nov 2023.
- Relatively high accuracy was observed for the 1st, 2nd, and 8th ranks, but the precision declined for ranks in between.
- Future research could explore methodologies specifically designed to improve accuracy for predicting mid-level ranks.
Reference
- Chung, J., Shin, D., Hwang, S., & Park, G. (2024). Horse race rank prediction using learning-to-rank approaches. Korean Journal of Applied Statistics, 37(2), 239-253.